Overview
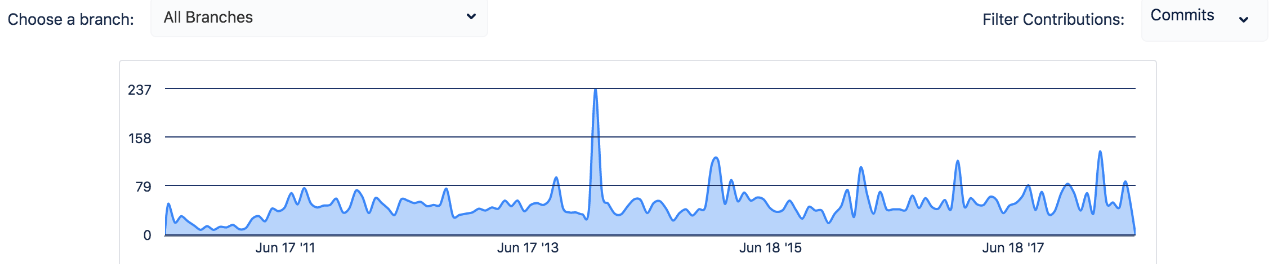
The Charts & Graphs plugin extends Bitbucket with our simple and pretty charts & graphs that let you visualize contributions, repository activity, and more.
You can't manage what you can't measure. When it comes to understanding your team's habits and contributions to source control, graphical displays provide the quickest insight and comprehension.
Charts & Graphs for Bitbucket helps you both measure and manage the team, ultimately improving the bottom line.
With great built-in visualizations, you get at-a-glance insights on the team, and the team members. With the ability to export data to Excel and other analytics tools you always have the option to take a deeper dive into trends and activity,
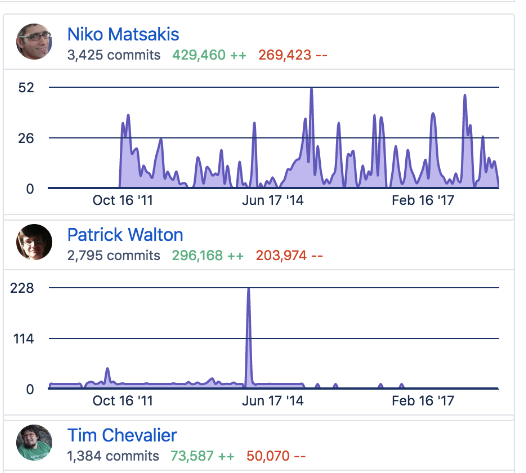
Commit charts for individual team members:
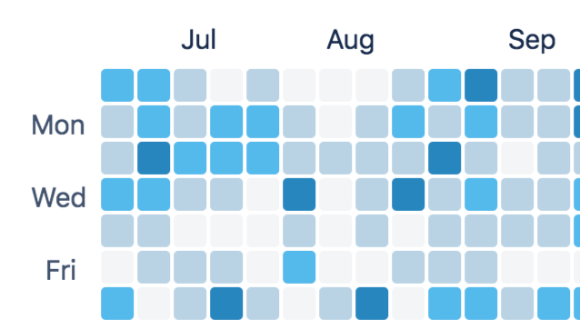
User contribution mapping: