Configuration Guide
After careful consideration, Custom Dashboards for Confluence was retired and archived on the Atlassian Marketplace on November 9, 2022. Current customers and evaluators were informed of this change on August 8, 2022. To migrate from Custom Dashboards for Confluence to Dashboard Hub for Confluence, refer to the FAQ. Please contact our support team if you have any questions.

The plugin allows you to replace the default global dashboard with your custom one in Confluence. It even enables you to have team dashboards or personal dashboards. The plugin also includes macros for displaying the popular pages, a beautiful weather widget or the daily Dilbert strip on your custom dashboard.
Please check out our blog post for many detailed examples of how to use Custom Dashboards for Confluence!
Feature Highlights
Replaces the native dashboard Replace the default global dashboard with a custom one defined on a simple wiki page
Full access control Limit access to the global dashboard by defining filter rules for selected users and groups
Unique and customizable Create different dashboards for different teams
Personal instances Allow users to create personal dashboards
Most importantly, Dilbert Display the daily Dilbert strip on your custom dashboard
Configuration Guide
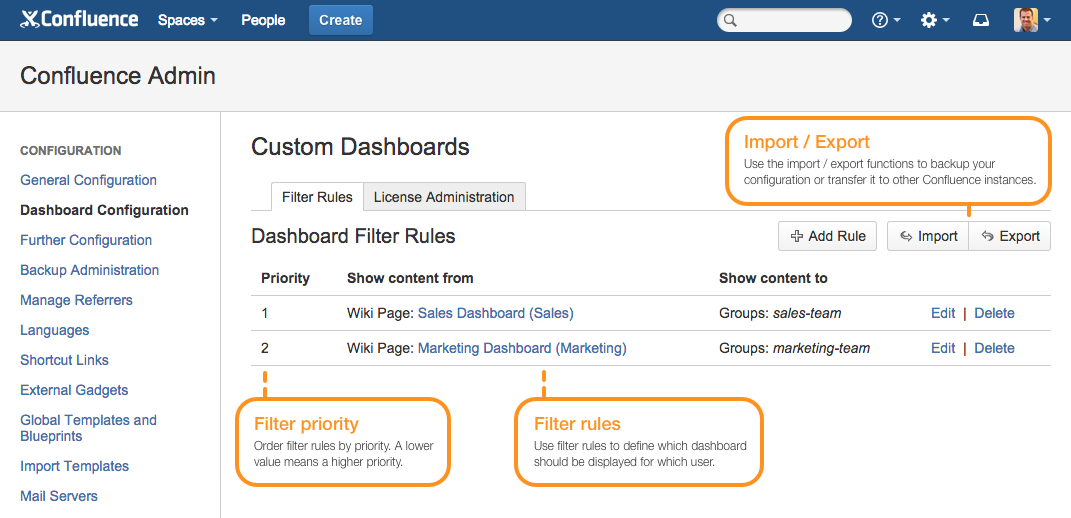
Go to Browse > Confluence Admin > Configuration > Dashboard Configuration to configure your filter rules. Filter rules define which dashboard needs to be displayed for which user when he clicks on a dashboard link anywhere within Confluence. Each filter rule is specified by the following information:
Filter Priority
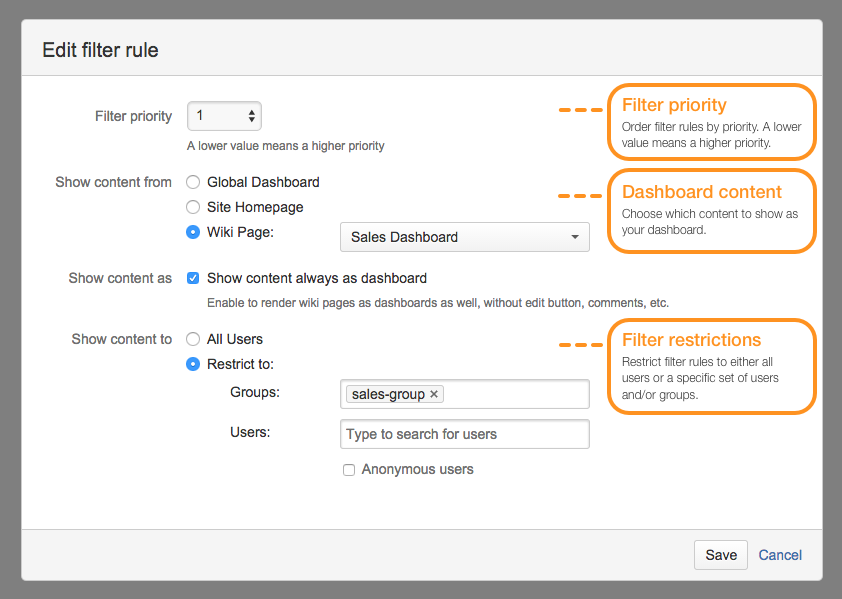
The priority of the filter rule. The priority is used to determine the order the filter rules should be processed. The priority is only important if you define more than one filter rule. A lower value means a higher priority.
Show content from
Which content to show as your dashboard. Choose one of the following options:
Global Dashboard | The default global dashboard of Confluence. |
Site Homepage | Either the global site homepage configured in the general configuration of Confluence or the personal site homepage, if the user has configured one in his user settings. Note: The user's personal settings will override the global setting. Use this option to allow personal dashboards. |
Wiki Page | Any wiki page within your Confluence. Use this option to display a specific wiki page as dashboard instead of the default dashboard. |
Show content as
Enable Show content always as dashboard to render wiki pages as dashboards as well, without edit button, comments, etc.
Show content to
You can restrict filter rules to either all users or a specific set of users and/or groups. Choose All Users if you want the rule to apply to all users or choose Restrict to and define the users and/or groups for which the rule should be applied to. Check Anonymous users if the restriction should also affect anonymous users.
Note: A filter rule will be applied as long as the user meets at least one of the restrictions. If no filter rule matches or no filter rules are defined, the default dashboard of Confluence will be displayed.
Configuring Common Use Cases
Dashboards for the team, the company, or individuals.
Custom Global Dashboard
Use the following configuration to display a wiki page instead of the default dashboard for all users:
Filter Priority: | 1 |
Show content from: | Choose Wiki Page and select the desired wiki page in the autocomplete field. |
Show content as: | Enable to render wiki page as dashboard. |
Show content to: | Choose All users. |
Team Dashboards
To create different dashboards for different teams you need to define a filter rule for every team:
Filter Priority: | 1 |
Show content from: | Choose Wiki Page and select the team dashboard (e.g. Sales Dashboard) in the autocomplete field. |
Show content to: | Choose Restrict to and specify the team (e.g. sales-group) in the Groupsautocomplete field. |
Filter Priority: | 2 |
Show content from: | Choose Wiki Page and select the team dashboard (e.g. Sales Dashboard) in the autocomplete field. |
Show content to: | Choose Restrict to and specify the team (e.g. marketing-group) in the Groups autocomplete field. |
Personal Dashboards
To allow personal dashboards set the site homepage as dashboard location. With this configuration the plugin tries to use the user's personal site homepage if configured. Otherwise the plugin reverts back to the global site homepage.
Filter Priority: | 1 |
Show content from: | Choose Site Homepage. |
Show content to: | Choose All users. |
Limit Access To Global Dashboard
You can also use the Custom Dashboards plugin to limit access to the default dashboard. E.g. the following configuration restricts the access of the default dashboard for anonymous users by redirecting them to another wiki page:
Filter Priority: | 1 |
Show content from: | Choose Wiki Page and select the desired wiki page which should be displayed to anonymous users in the autocomplete field. |
Show content to: | Choose Restrict to and check Anonymous users. |
Macros for Sprucing up Dashboards
In addition to existing macros like the Chart Macro, Panel Macro or the Image Slider Macro, the Custom Dashboards plugin offers the following macros to help you make your dashboards even cooler:
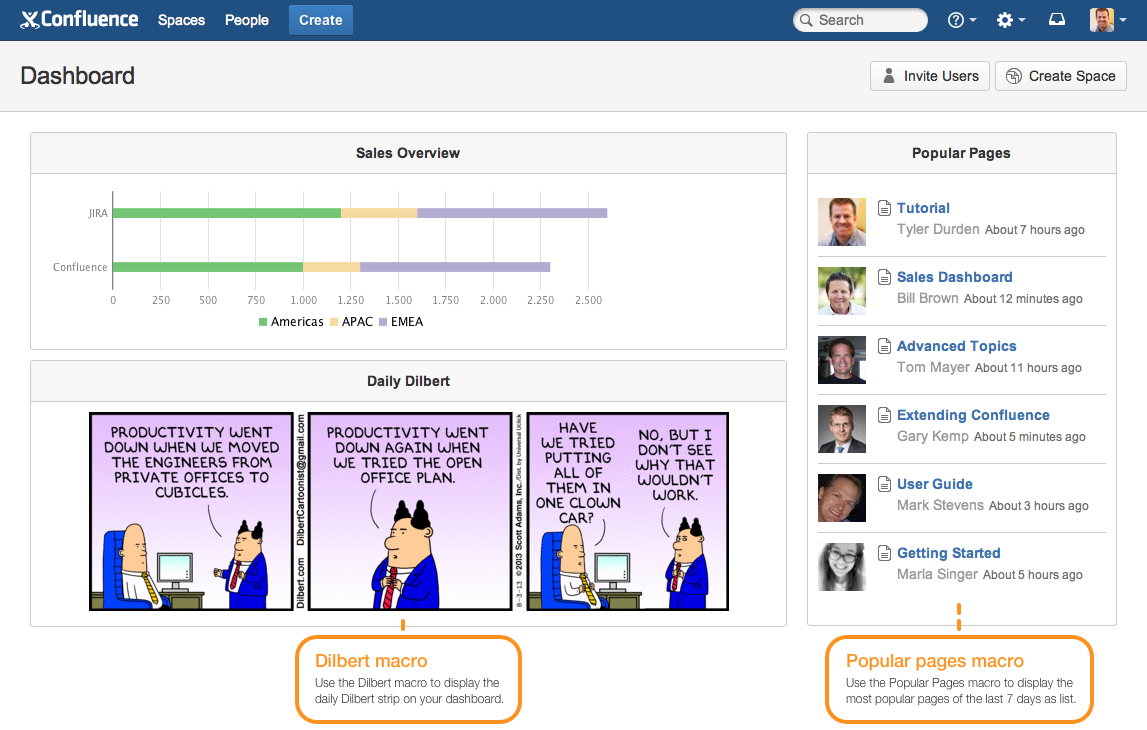
Popular Pages Macro
Use the Popular Pages macro to display the most popular pages of the last 7 days as list. It allows you to display the same content as shown on the right side of the default dashboard of Confluence.
Macro Parameters
Parameter | Default | Description |
|---|---|---|
Max Results | 10 | The maximum number of results to display. |
Hide Header | false | Allows you to hide the header of the table. |
Dilbert Macro
Use the Dilbert macro to display the daily Dilbert strip on your dashboard and make your employees smile in the morning.
Note: Mohami is the official licensed distribution partner of Dilbert for Atlassian Confluence. If you are looking for a legal solution to display the daily Dilbert strip in Confluence, this is the way to do it.
Macro Parameters:
Parameter | Default | Description |
|---|---|---|
Width | None - Maximum width will be used. | Width of the Dilbert strip in pixels. Leave blank for maximum width. |
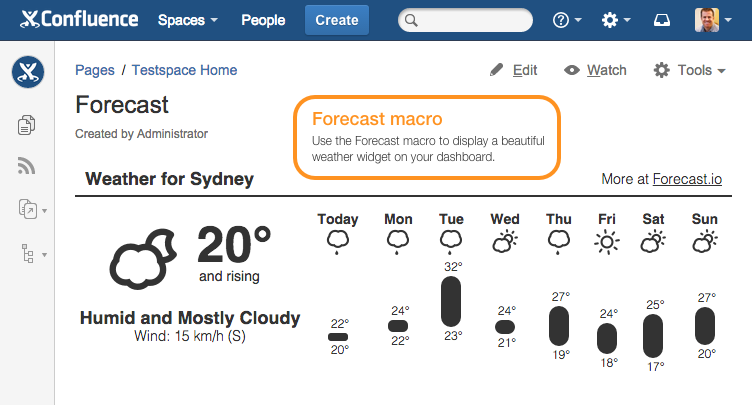
Forecast Macro
Use the Forecast macro to display a beautiful weather widget in Confluence. Choose whether you want to display the current weather with or without a daily forecast.
Note: The weather widget will only be displayed if the user's browser has access to the internet. Also the city search feature only works if your Confluence server has access to the internet. If your Confluence doesn't have internet access, please enter latitude and longitude manually.
Macro Parameters:
Parameter | Default | Description |
|---|---|---|
City Name | None - No name will be displayed in header. | Name of the city displayed in header. Leave blank for no name. |
Latitude | - | Latitude of the city. |
Longitude | - | Longitude of the city. |
Display Mode | currentWeatherWithDailyForecast | Choose whether to display the current weather with or without a daily forecast. Valid values are:
|
Units | us | Choose between the following units:
|
Text Color | #333333 | Color of all the text in the widget. |
Bar Color | #333333 | Color of the bars in the widget. |
Animated Skycons | true | Enable to display animated skycons. |
Hide Header | false | Enable to hide the header of the widget. |
Screenshot Walkthrough
FAQ
Learn how to migrate from Custom Dashboards for Confluence.
Overview
After careful consideration, we have decided to retire Custom Dashboards for Confluence as part of our ongoing product lifecycle management process. While this app will be retired, we recommend existing customers use Dashboard Hub for Confluence for many of the same reporting features. To help make this transition easier, we’ve emailed a notice and discount code to all current customers to purchase Dashboard Hub for Confluence.
You can continue using your installed license, and we will continue supporting customers with active licenses, but we will no longer release updates through the Atlassian Marketplace. We will archive the app on November 9, 2022, and your license will no longer be renewable 90 days before this date.
We sincerely appreciate your understanding, and we hope the impact on your organization and customers will be minimal. Please don't hesitate to contact our support team if you have any questions.
Why Dashboard Hub for Confluence
Dashboard Hub for Confluence offers a range of pre-defined dashboards templates for ITSM, Agile, or DevOps teams in Confluence. Teams can choose from 70+ gadgets, metrics, and powerful custom charts to display and visualize key data and share it on new or existing Confluence pages. Not to mention that it provides a Data Center, but also a Cloud version for those thinking of moving to the Atlassian Cloud. And for those customers coming from Custom Dashboards for Confluence, we have implemented all your favourite features, check the following table to discover the feature parity.
Feature Parity
Custom Dashboards for Confluence | Dashboard Hub for Confluence | |
|---|---|---|
Filter Rules | Replace the default global dashboard using a custom dashboard defined in a wiki page. For doing so, you create filter rules to define which dashboard needs to be displayed for which user when he clicks on a dashboard link anywhere within Confluence. View more in the app documentation. | Dashboard Hub for Confluence (in both, Data Center and Cloud) provides the ability to define rules to filter which dashboard is shown to either all users or a specific set of users and/or groups. These rules allows you to:
Read more in our documentation https://help.roninpixels.com/RDD/filter-rules-display-dashboards-by-user-or-group . |
Popular pages macro | This macro displays the most popular pages of the last 7 days as list. It displays the same content as shown on the right side of the default dashboard of Confluence. View more in the app documentation. | There’s not a specific macro for this in Dashboard Hub for Confluence, but you can use the CQL search gadget within a macro. To do this, use a CQL query like: Pages created in the last week
CODE
Pages where the current user has been mentioned
CODE
Pages watched and recently updated:
CODE
|
Dilbert macro | This macro shows a Dilbert strip on your dashboard. View more in the app documentation. | You can use the Dilbert gadget counterpart. No further configuration is needed, just add it to your dashboard or within a page using the dashboard macro. Read more in our documentation https://help.roninpixels.com/RDD/dilbert-strip . Your browser needs access to the internet to reach the Dilbert service and display the strip. |
Forecast macro | This macro displays weather information, with or without daily forecast. View more in the app documentation. | You can use the Weather gadget counterpart. Add it to your dashboard or within a page using the dashboard macro. The former weather service https://blog.darksky.net/ is no longer used due to its EOL the , so we use the Weather API from https://www.meteomatics.com/en/weather-widget/. Read more in our documentation https://help.roninpixels.com/RDD/weather-forecast . Your browser needs access to the internet to reach the weather service and display the information. |